
AIA
2015
Annual
Report

02 Letter from Robert Ivy
04 Innovation
Strategic repositioning
Digital transformation
Chapter accreditation
Diversity
Continuing education
06 Driving awareness
I Look Up campaign
I Look Up Film Challenge
08 Advocacy
Year of the advocate
Achieving progress together
Advancing legislation
Construction industry leadership
Collaborating to advance the profession
10 Support
The business of architecture
Mobile management
New contracts & a digital platform
AIA Trust: New, improved
12 Data driven
Business & firm support
Economic indicators
Practice-relevant research
Research initiatives
Building Research Information
Knowledgebase
Contents
14 Sustainability
Design & health research
Materials transparency
Supporting resilient communities
The 2030 Committment
Sustainability in energy
Sustainability partnerships
16 Community
Emerging professionals
Communities by Design
18 AIA Convention 2015
Bringing a profession together
Sustainable convention
20 Recognition
Recognizing excellence
COTE Top 10 for Students
22 Architects Foundation
Addressing local & global needs
National Resilience Initiative
Resilience & reconstruction
26 Financials
p // 12015 ANNUAL REPORT
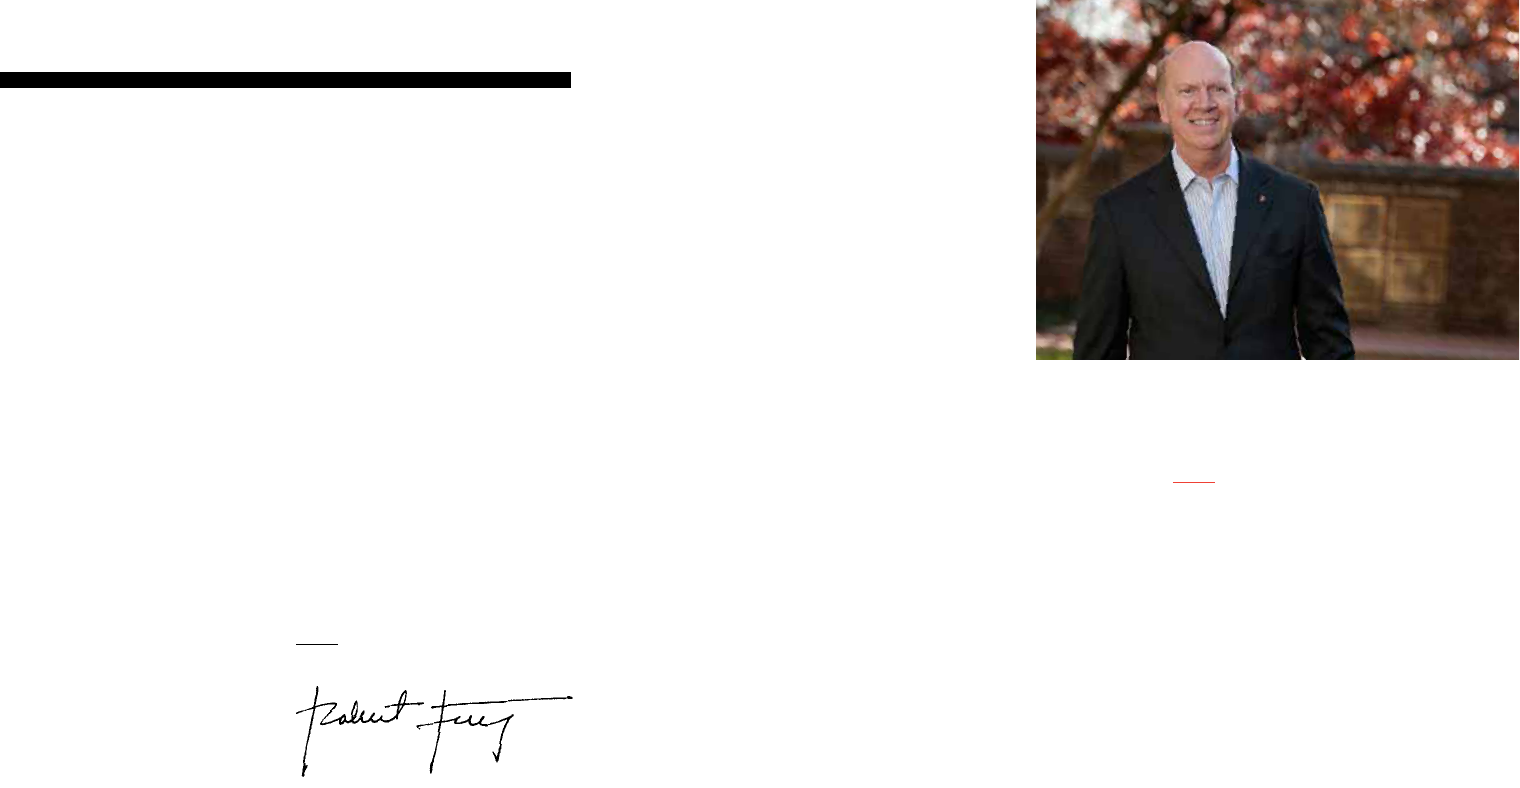
Letter from
Robert Ivy
2015 was a busy year—a healthier
economy, near-full employment, backlogs
swelled to capacity. And, an AIA remade
as a bold and nimble dynamic network for
our members. This resurgent AIA—fine-
tuned for the 21st century—is already
witnessing results.
Our profession is better understood and
appreciated, the dividend of a persuasive
public awareness campaign. For the first
time in more than a decade a visually
compelling national television message
spoke to the essential role of architects
and architecture in our lives. This AIA
effort alone reached 66 million people.
We leveraged this visibility to millions
more with online ads, amplifying our
message and connecting with critical
new audiences through social media, an
inspiring documentary, and a national
film competition. Members can take
the campaign local, tailoring it for their
hometowns.
We moved audiences from passive to
passionately-engaged.
Our profession has more influence.
AIA advocacy efforts helped persuade
Congress to restore and extend the
179D tax deduction, at once an attractive
business development and practice
management tool. AIAU set a new standard
of quality for delivering online continuing
education, reflected in the 95 percent of
course evaluators who’d recommend it to
a friend. At a record-setting crowd at our
convention, former president Bill Clinton
praised architects for their principled
commitment to address climate change
and hinged success in limiting its severest
consequences on others’ being able to
think and act as we do.
Our profession took effective action. We
made meaningful progress on design and
health, resiliency, and the sustainability of
building materials. Our AIA member-led
inaugural 2015 Resilience Summit and
the second Design & Health Research
Consortium charted courses shaped by
our leadership. And where we need to do
more, for example, increasing diversity in
the profession, we conducted our first-
in-a-decade survey on how gender and
race influence perceptions and equity in
the field.
You are the thread connecting all of the
2015 AIA accomplishments. You are the
AIA dynamic network we’re dedicated to
supporting.
Realizing potential—we strive for it
personally and professionally.
Thank you for another extraordinary year.
Robert Ivy, FAIA
EVP/Chief Executive Officer
“ You are the thread connecting all of the 2015 AIA
accomplishments. You are the AIA dynamic network
we’re dedicated to supporting.”
Robert Ivy, FAIA
p // 2 p // 32015 ANNUAL REPORTTHE AMERICAN INSTITUTE OF ARCHITECTS

Creating Cultural Change, the theme of the 2015 Women’s Leadership Summit, brought more than 300 to
Seattle to develop strategies that better support women in the profession and explore new paths to leadership.
Innovation
“ Diversity and inclusion is a priority of AIA.
We have made progress, but not fast enough.
We have great opportunity now to look at how
to achieve the equity, diversity and inclusion
in AIA member firms through a creative means
and provide a framework for the profession
to act faster and better to meet a growing
demand for architects.”
2015 AIA President, Elizabeth Chu Richter, FAIA
Strategic repositioning
The Strategic Council, our new “think
tank,” helped us become more proactive,
anticipate trends and emerge as a leader
in predictive and actionable research.
In 2015, the Council set out a five-year
Strategic Plan that focuses our priorities.
We’ve begun aligning our operations to
meet the goals of the Plan—to reinforce the
stature of architects, expand our influence,
and demonstrate the role architecture
plays in serving society’s needs.
Digital transformation
The new digital foundation for the 21st
century AIA is nearly completed. The
vision: Transform to provide increased
member value. Every legacy technology,
software and process was scrutinized.
We asked the hard question “why” about
processes. Now we’ve changed and
are working differently on your behalf.
We rejuvenated the member and user
experience across our entire landscape,
enhancing AIA operations by adopting
an “agile” project management approach
to our work. Using agile, we focused on
efficiency, collaboration and learning from
the results. A revamped and mobile-ready
AIA Architect is increasing readership
with open rates consistently higher
than industry average. We streamlined
a cumbersome online member renewal
process, making it easier by eliminating
four unnecessary steps. Online renewals
increased 11 percent. In spring 2016, a
new professional AIA website will deliver
the most compelling and relevant content.
Chapter accreditation
High-quality core member services
focused the work of chapter leaders
throughout 2015. This top Member
Services Resource Task Force
recommendation generated statewide
conversations on streamlining operations
and administration so chapters can
access free resources for higher-
quality continuing education and
communications. Twenty-five states
received grants totaling more than
$315,000 and a member service toolkit
was developed with sample policies and
best practices. All AIA chapters signed
a Member Service Agreement and more
than 30 are considering becoming part
of a state or local chapter. Two hundred
thirty-three were accredited by five
member accreditation teams, ensuring
that members have access to quality
services and resources.
Diversity
The highly successful AIA Women’s
Leadership Summit brought 315
architects, interns and students to Seattle
in a vital show of support for gender
equity. Work–life balance, leadership
opportunities and greater attention to
developing a more diverse pipeline were
among the strategies to better support
women in the profession. In addition,
AIA completed its first diversity survey
in a decade and found much remains
to be done. Now, with data from 7,500
respondents, we are better equipped to
establish programs and deliver results.
Already, a blue-ribbon panel is at work
on an action plan for the AIA Board by
the end of 2016.
Continuing education
Members logged an impressive 1.2 million
hours of continuing education through
the AIA network. Increasingly, more credit
hours are being earned through AIAU, our
new online education platform. In 2015,
we added 75 more rigorously curated
courses, launched a star rating system
to rate and rank the courses allowing us
to retire those that fell short. It’s serious
quality control and it’s working. More
than 95 percent of those evaluating
their courses would recommend them to
a colleague. More classes will be added
to the AIAU portfolio in 2016.
Bold strategies and organizational changes
helped us better support our members and
the profession while expanding architecture’s
reach, influence and impact.
p // 52015 ANNUAL REPORTp // 4 THE AMERICAN INSTITUTE OF ARCHITECTS
Driving awareness
I Look Up campaign
What do you see when you look up?
That straightforward question anchored
the bedrock message of our I Look Up
public awareness effort: Architects and
architecture play an essential role in our
lives. Our first advertising campaign in
more than a decade invited the public to
look up and be inspired by the architecture
that surrounds us and shapes the
identities of our communities.
We made the message mobile—shareable
and scalable across all forms of media.
Television advertising generated 66 million
impressions. Another 5 million watched
our ad through online channels. Overall,
we reached nearly 30 million people across
all communication channels in 2015 and
expanded our social networks more than
15 percent. Thousands answered the I
Look Up question by posting photos of
their favorite architecture to ilookup.org.
It’s a remarkable response that gets to
the heart of the architect’s endeavor to
create community.
I Look Up Film Challenge
To maintain momentum throughout
2015, we produced premium film content,
including a documentary about the life of
sight-impaired architect Chris Downey.
This film grew into the I Look Up Film
Challenge that encouraged participants
to produce a film showcasing a unique
perspective on architecture’s effect on
everyday life. The film challenge pulled a
new, energized audience into the AIA orbit.
Three winners emerged from more than 26
inspiring film entries and were announced
at the opening of the inaugural Chicago
Architecture Biennial. The film challenge
reached two million people, including
300,000 through a social media driven
People’s Choice Awards. The Tribeca Film
Festival’s website featured the winners’
film under the fitting title “Three Short
Films That Will Inspire You to Appreciate
Architecture.”
2015 AIA President Elizabeth Chu Richter, FAIA (center) presented the I Look Up Film Challenge awards
to the three winning teams at the Chicago Architecture Biennial. “These films,” said Richter, “inspire the
world to look up and appreciate the beauty of architecture.”
“The experience of
working on the
I Look Up Film
Challenge changed
my perception of
architecture by
learning about
how much work
and passion goes
into designing a
building. It’s a lot
like filmmaking in
a way—if you do
it right, it feels so
natural and organic
that nobody ever
thinks about how
it’s made.”
Filmmaker, I Look Up
Film Challenge
p // 72015 ANNUAL REPORTp // 6 THE AMERICAN INSTITUTE OF ARCHITECTS

Advocacy
“…eliminating this language would be a significant
setback in the effort to make the nation’s building
stock more sustainable.”
AIA EVP/CEO Robert Ivy, FAIA and Michael Brune, Sierra Club Executive
Director, writing to Congress to oppose repeal of Section 433
>>> SPOTLIGHT
Preserving
2030 goals
The foundation for
reducing greenhouse
gas emissions in public
buildings—Section
433 of the Energy and
Independence Security
Act of 2007—set a
goal that all new or
significantly renovated
federal buildings be
carbon neutral by 2030.
AIA’s 2030 Commitment
championed similar
objectives to reduce the
use of non-renewable
energy sources in
building construction
and maintenance.
When an amendment
was proposed to a
Senate energy bill that
would have gutted
the 2030 target goals,
AIA joined forces with
the Sierra Club and
other organizations
to continue fighting
the move.
Strategic efforts, combined with the collective
voice of nearly 88,000 members, achieved big
wins in federal, state and local governments
and reinforced our commitment to protect the
built environment.
In 2015, ArchiPAC, the AIA federal political action committee, raised more than $130,000 to help AIA
raise its political reach and advocate for policies that move our profession and country forward.
Year of the advocate
Advocating for the profession is a core AIA
tenant. AIA designated 2015 the Year of
the Advocate, recognizing that creating
a culture of advocacy will ensure our
collective voice is considered whenever and
wherever policymakers make decisions that
affect our profession. Within the first week
after being announced, joining members
doubled the ranks of AIA Advocacy
Network. This multi-year initiative included
a new advocacy pilot launched in three
states to help build an effective federal,
state and local advocacy infrastructure. The
increased interest in advocacy attracted
record-setting donations to ArchiPAC,
our federal political action committee. We
raised more than $130,000 to help AIA
expand its political reach in Washington.
Achieving progress together
In response to a major AIA grassroots
push, Congress voted to restore and extend
the 179D energy efficient commercial
buildings tax deduction, enabling
architecture firms to claim a valuable
deduction for sustainable work on public
buildings. AIA built a strong coalition that
includes hundreds of organizations and
businesses to fight an effort to repeal the
2030 energy efficiency targets for federal
buildings.
Our federal advocacy program in 2015
included an initiative to reform how the
federal government hires and compensates
architects who design federal facilities.
This AIA focus spurred the U.S. General
Services Administration to announce
plans to change the competition process
for design-build projects and work with AIA
to better train contracting employees on
how to establish compensation rates for
architects who pursue federal work.
Advancing legislation
AIA continued building bipartisan support
for other federal legislation important to the
profession: The National Design Services
Act to provide student debt relief for
architecture graduates; the Safe Building
Code Incentive Act to encourage states
to adopt building codes in exchange for
increased disaster funding; and the Historic
Tax Credit Improvement Act to preserve
and improve the incentive for undertaking
historic preservation.
Construction industry leadership
AIA staff collaborated with industry
partners and closely monitored issues that
impact how architects work. The AIA policy
team analyzed legislative and regulatory
issues related to liability exposure for
architectural firms, qualifications based
selection, construction administration
and the use of school barricades, among
others. AIA strengthened an already robust
partnership with the International Code
Council, formally agreeing to collaborate
on supporting and advancing the adoption
of modern building codes. Our “One Code”
policy led to continued collaborative
leadership on the development of the
International Green Construction Code,
the IGCC, which, with wide industry
stakeholder engagement, is being
combined with ASHRAE Standard 189.1 to
produce a single regulatory tool for green
construction.
Collaborating to advance the profession
In 2015, members and staff worked
together with the U.S. Department of
Energy (DOE) to develop a single definition
of a net-zero energy building, helping
policymakers and practitioners better
define sustainable design. In conjunction
with the DOE we hosted a workshop where
nearly 100 experts from 60 organizations
envisioned buildings of the future. AIA
staff and member volunteers provided
training to the staff at the Architect of
the Capitol to improve their post-disaster
ability to evaluate facilities, buildings and
infrastructure. We concluded a three-
year cooperative grant with the U.S.
Department of Commerce to help open
international markets to architects, which
featured working-abroad training sessions
for members at chapters in Houston and
San Francisco.
p // 92015 ANNUAL REPORTp // 8 THE AMERICAN INSTITUTE OF ARCHITECTS
Support
“…the only way you can really protect yourself is with a strong
payment plan. I always recommend using an AIA contract.
It itemizes the complete scope of work, materials and
installation costs. If you see flooring show up on the job…,
you could pay them for that. But don’t pay them before you
see the materials show up. And that’s why the AIA contract
is brilliant, ‘cause it really protects you.”
John DeSilvia of the DIY Network’s “Rescue My Renovation”
>>> SPOTLIGHT
Entrepreneur
Summit
In July AIA held the
Entrepreneur Summit, a
two-day event captured
on video that offers
interesting perspectives
on what it means to be an
architect. The takeaway:
An architect’s education
is the foundation from
which to build a practice
or chart a versatile
career path. Conceived
and hosted by 2015 AIA
President Elizabeth Chu
Richter, FAIA, the summit
addressed how architects
can harness potential to
enhance their value to
their firm or better serve
clients and communities.
New ways to apply design
thinking was a major
theme. One architect-
panelist developed
project management
software that became
a separate business
enterprise; another
developed a materials
fabrication business; and
everyone discussed how
to own your story with the
media. Art Gensler, FAIA,
delivered an inspiring
keynote packed with
candid advice on how to
build and run a successful
firm. Gensler’s speech and
a panel on new business
models can be found for
free on AIAU.
The business of architecture
We expanded the tools we provide
members to help them build their
businesses and manage their careers. For
proven firms and those just-launched,
the tools mark new paths to prosperity.
Our vibrant network of Knowledge
Communities added member-to-member
resources, so fellow professionals can
stay on top of practice trends with
whitepapers, webinars and documented
best practices.
Mobile management
Courtesy of the AIA Small Firm
Roundtable (SFRT) and the Young
Architects Forum, members now have
AIAKinetic, a mobile app that connects
small firms to a comprehensive suite of
real-world how-tos and best practices.
The SFRT also assembled a team of
member volunteers to keep the content
timely and relevant.
New contracts & a digital platform
AIA released 10 new documents and forms
in the Design-Build family—endorsed by
the Construction Specifications Institute—
and four new agreements and forms in
our core Conventional family, used for the
design-bid-build project delivery method.
In December, we premiered a digital
platform that improves ACD5 system
performance, ensuring continued ease of
use and building on customer satisfaction
ratings that already exceeded year-end
targets. In 2015 we exceeded one million
document downloads for the second year
in a row and our contracts were touted on
an NBC TODAY show segment “How to
Shop for a Contractor.”
Deeper industry alliances
AIA and the Associated General
Contractors of America expanded their
existing collaboration. Already at work
on shared challenges and education-
related issues, these representatives of
the building team executed an MOU with
the Construction Owners Association of
America, our counterpart in the design
and construction industry, to further
advance common goals. A similar MOU
with ASHRAE, drafted in 2015, takes
effect in 2016.
AIA Trust: New, improved
Practicing architecture implies risk for
career newcomers and veterans alike. AIA
Trust is all about helping manage risk. An
all-new AIA Trust website, launched in
2015, makes resources and benefits easier
to find and better tailored to our member’s
personal and professional needs.
AIA Trust now has white papers on
topics including effective contract
administration, a comparison guide
about professional liability policies,
documentation techniques to protect your
practice and the risks of condominium
construction. Added were four webinars
to help you run a successful practice
and navigate the Affordable Care Act.
Another webinar gives AIA chapters an
overview of insurance needs.
For firm owners with a pending E&O claim
or another legal matter, the AIA Trust
launched the AIA Trust Legal Network in
2015. It is an easy way to identify qualified
A/E construction lawyers who can help
manage an issue. Check out the AIA
Trust’s other resources, from a how-to
guide on starting and running a firm to
the dos and don’ts of ownership transition.
Industry standard tools, product launches and
new services made it easier for architects and
design professionals to do business and manage
risk in 2015.
The AIA Home Design Trends Survey highlights how residential architects are shaping how homes
function, look and integrate into communities. Each quarter, billings and inquiries at more than 600
architecture firms documents the financial health of firms in the residential sector.
p // 10 p // 112015 ANNUAL REPORTTHE AMERICAN INSTITUTE OF ARCHITECTS
Data driven
Quality data, market intelligence, research
and sharp insights equipped members and the
industry to make good business decisions.
Business & firm support
Good decisions require good data. AIA’s
influential Architecture Billings Index ably
predicted the 2015 recovery. The data
appeared in more than 800 articles and
drew coverage by the Associated Press
and Reuters. The AIA Home Design Trends
Survey helped members stay competitive
with quarterly data showing where new
home and remodeling demand converged
with consumer interests.
And the 2015 Compensation Report
added to its already comprehensive data.
The Report covers 39 positions, including
job descriptions, for 27 states, 27 metro
areas and 15 cities. Plus we debuted the
Compensation Survey Salary Calculator
that gives emerging professionals salary
results for 17 positions.
Economic indicators
In 2015, we added two economic insight
tools. A monthly indicator includes
data on employment, construction
spending, housing starts and vacancy
rates. AIA also improved its semiannual
State Economic Profiles, a collection of
national, regional and state employment
and construction data—tools that prove
useful for government advocacy and
media outreach.
Practice-relevant research
A 2015 Research Summit, a joint activity
of the Board Knowledge Committee and
Practice and Prosperity Committee,
brought together practitioners and
members of the Academy to recommend
how AIA can support increased literacy
and use of research. A 2016 roadmap will
augment AIA’s research efforts.
Research initiatives
A jury representing the College of Fellows
and the Board Knowledge Committee
selected four 2015 recipients for the
Upjohn Research Initiative Program
that provides matching funds of up to
$30,000 for applied research projects
advancing design and professional
practice knowledge.
The College of Fellows also awarded
the 2015 Latrobe Prize of $100,000
to a team led by Woodbury University’s
Arid Lands Institute (ALI). The grant will
enable ALI and its partners to develop
and test a proprietary digital design
tool which, when fully realized, will
support communities and design teams
developing and building water-smart
infrastructures and devising and shaping
public policy for drylands urbanism.
Building Research Information
Knowledgebase (BRIK)
This free portal to peer-reviewed
research projects and case studies grew
to 19 contributing organizations in 2015
across government agencies, architecture
firms, academics and research groups. An
additional feature was added: Member-
only access to thousands of journals
through three digital library collections.
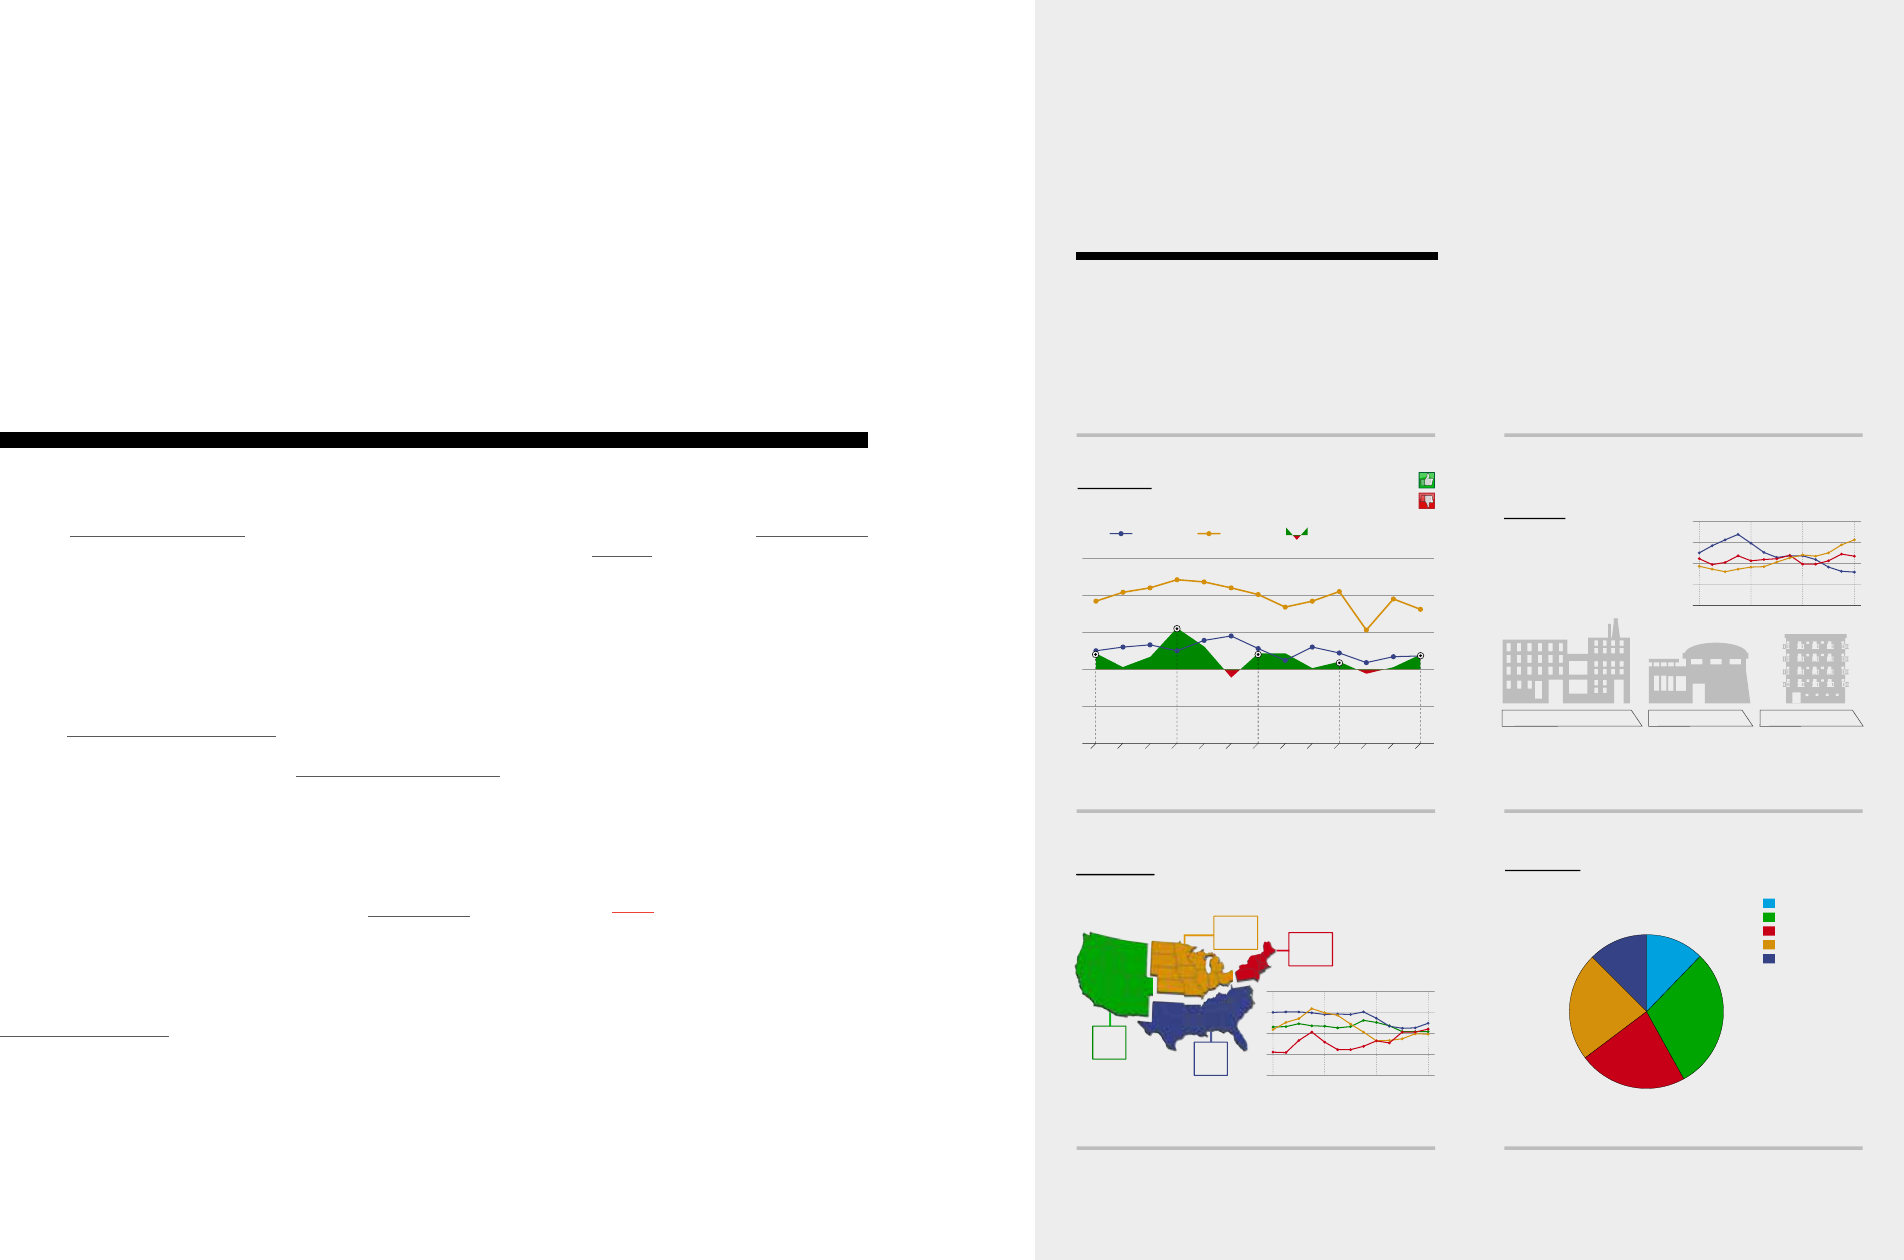
ARCHITECTURE BILLING INDEX
NATIONAL REGIONAL SECTOR PRACTICE
ABI
* All graphs represent data from March 2015 – March 2016.
March 2016
The Architecture Billing Index (ABI) is a diffusion index derived from the monthly Work-on-the-Boards survey, conducted by the
AIA Economics & Market Research Group. The ABI serves as a leading economic indicator that leads nonresidential construc-
tion activity by approximately 9-12 months. The survey panel asks participants whether their billings increased, decreased, or
stayed the same in the month that just ended. According to the proportion of respondents choosing each option, a score is
generated, which represents an index value for each month. An index score of 50 represents no change in firm billings from the
previous month, a score above 50 indicates an increase in firm billings from the previous month, and a score below 50 indicates
a decline in firm billings from the previous month.
NATIONAL
Architecture Firm Billings Close Out First Quarter on an Upswing
Graphs represent data from March 2015 – March 2016.
40
45
50
55
60
65
BillingsInquiriesDesign Contracts
Mar-16Feb-16Jan-16Dec-15Nov-15Oct-15Sep-15Aug-15Jul-15Jun-15May-15Apr-15Mar-15
Below 50 =
Above 50 =
50 = No change
from previous
period
55.6
51.9
52.2
52.3
51.3
West:
50.4
South:
52.4
Northeast:
51.0
Midwest:
49.8
REGIONAL
Midwest Firms See Continued Weakness; Firms in Other Regions Report Modest Growth
Graphs represent data from March 2015 – March 2016 across the four regions.
50 represents the diffusion center. A score of 50 equals no change from the previous month. Above 50 shows increase; Below 50 shows decrease.
3-month moving average.
40
45
50
55
60
Mar-16Nov-15Jul-15Mar-15
Institutional: 48.0 Residential: 55.7Commercial/Industrial: 51.8
SECTOR
Upswing at Residential Firms and Slide at
Institutional Firms Continue in March
Graph represents data from March 2015 – March 2016 across the
three sectors.
50 represents the diffusion center.
A score of 50 equals no change from the previous month. Above
50 shows increase; Below 50 shows decrease.
3-month moving average.
40
45
50
55
60
Mar-16Nov-15Jul-15Mar-15
PRACTICE
2015 Saw a Mixed Performance Relative to Expectations for Firm Profitability
Units: 2015 profitability relative to firm expectations, % of firms
12.3%12.3%
29.9%
22.6%
23.0%
Significantly exceeded
expectations
Modestly exceeded
expectations
Met our expectations
Modestly underperformed
expectations
Significantly underperformed
expectations
Average compensation for
architectural staff positions
averaged just under
$80,000 at the beginning
of 2015, up about 3.5% from
early 2013 levels, or 1.75%
per year.
2015 AIA Compensation Report
Architecture Billings Index
A leading economic indicator, the Architecture
Billings Index (ABI) provides a nine-to-12 month
lead time between architecture billings and
nonresidential construction spending. It is closely
followed as an indicator of the health of the
construction industry.
>>> EXAMPLE
p // 132015 ANNUAL REPORTp // 12 THE AMERICAN INSTITUTE OF ARCHITECTS
2015 COTE Top Ten Plus award winner: U.S. General Services Administration, Seattle Federal Center South Building 1202. After the
first year, quantifiable metrics showed the facility’s metered energy performance met every design target, including the contractually
required energy performance and the AIA 2030 Committment. Photo Credit: Benjamin Benschneider
Sustainability
We put the power of our sustainability
portfolio to work in 2015, using diverse new
opportunities to improve health, enhance
community resilience, reduce energy use and
promote materials transparency.
Design & health research
2015 marked the first full year of the AIA
Design & Health Research Consortium,
created to strengthen understanding of
links between design and health. The
consortium developed evidence-based
tools for professionals and translated the
findings for policymakers and the public.
Eleven charter members funded research
on everything from the effects of indoor
temperatures on sleep deprivation and
depression (University of Florida) to a
“best design” competition for a mobile
isolation treatment unit to combat the
Ebola epidemic (Texas A&M University’s
Center for Health Systems and Design). Six
universities joined the consortium in 2015.
Materials transparency
In a sustainable built environment,
architects play an important role in
helping clients and communities make
better choices about the health and
environmental impact of building
materials. A working group of architects,
attorneys and insurers was convened to
evaluate risks of this opportunity. The
group worked with AIA’s contract team
to develop a model contract. A Materials
Transparency white paper is also available
on the AIA website.
Supporting resilient communities
Creating resilient communities requires
new and collaborative approaches
among stakeholders. We expanded
our contribution to this effort with the
2015 Resilience Summit that gathered
representatives of government agencies,
scientists, policy experts and the insurance
industry. We examined what makes a
community “resilient” and who holds the
responsibility to ensure it is. The Summit
Report laid out next steps. We are also
assisting AIA chapters participating in
the Rockefeller Foundation 100 Resilient
Cities initiative, providing practice and
policy-focused resources and access to
a digital network where they can share
best practices as they host workshops and
meet with community officials to promote
design as part of making communities
more resilient.
The 2030 Commitment
When firms sign the 2030 Commitment
they support consistent and rigorous
metrics relating to building performance
to achieve carbon-neutral buildings
by 2030. AIA partnered with the U.S.
Department of Energy (DOE) in 2015 to
simplify the reporting process through
the AIA 2030 Design Data Exchange
(DDx), a web-based interface that allows
firms to track and report energy use in
their design projects. It also helps AIA
monitor its own goals. The interface
streamlines the job of reporting data
and enables project information to be
entered in real time. Plus, architects
can use the sophisticated reporting
and research tools to compare building
performance projections with similar
projects. Information about specific
firms, projects and clients remains
completely confidential.
Sustainability in energy
In one example of our effort to increase
energy-efficient design literacy in our
profession, AIA laid out recommendations
at DOE’s 2015 Energy Codes Conference
to increase energy efficiency in existing
buildings. The presentation reviewed AIA’s
work on incentives, energy modeling,
energy-efficiency finance and deep
energy retrofits.
Sustainability partnerships
We partnered with Architecture 2030
and AIA Seattle to launch the AIA+2030
Online Series that provides members
with an interactive, step-by-step guide
to achieving sustainable solutions.
Sharing knowledge is intended to help
professional designers create super-
efficient buildings—and provide firms with
skills to set them apart in the marketplace.
AIA also convened the inaugural meeting
of a broad group of energy-efficiency
experts—the Energy Leadership Group—
to help set the agenda for AIA’s energy-
related activities and provide guidance
on the AIA’s energy policy formation and
activities, including advocacy and code
development and adoption.
“ If architects ask for disclosure of product
contents without explaining why they are asking,
their intent to use that information is open to
interpretation. It is important to be clear with
clients and with the public about the reasons for
seeking and receiving disclosure documents.”
2015 AIA Materials & Risk Summit
p // 152015 ANNUAL REPORTp // 14 THE AMERICAN INSTITUTE OF ARCHITECTS
Emerging professionals
In 2015, we unveiled powerful programs
and alliances to help emerging pro-
fessionals excel. Targeted educational
opportunities, financial support and
creative outlets are mainstays of the effort.
AIA’s 2015 exhibition showcasing the
group’s startling creative talent perfectly
underscores the importance the next
generation of architects.
AIA and the Association of Collegiate
Schools of Architecture hosted an AIA
Convention conference to stress the
link between architectural education and
practice. We also partnered with Black
Spectacles to offer online prep tutorials
for the Architect Registration Exam,
enhancing our support for emerging
professionals on the path to licensure.
And the National Associates Committee
and Young Architects Forum expanded
their reach by helping shape a virtual
leadership event that drew 300 partic-
ipants live-streamed from Washington,
D.C. to AIA chapters in Boston, Cleveland,
Phoenix and San Antonio.
AIA provides ongoing scholarships
to emerging architects, including the
AIA Jason Pettigrew Memorial ARE
Scholarship, now managed through the
Architects Foundation. The Henry Adams
Scholarship dispersed nearly $90,000 to
91 schools and 213 students. AIA awarded
$85,000 in grants to augment existing
AIA chapter scholarship programs.
Another 2015 financial initiative targeted
unpaid internships with the launch of the
Know Your Worth campaign. It featured
two videos, “Value Your Work” and
“Value Our Future,” about the collective
importance of getting paid for internship
hours worked.
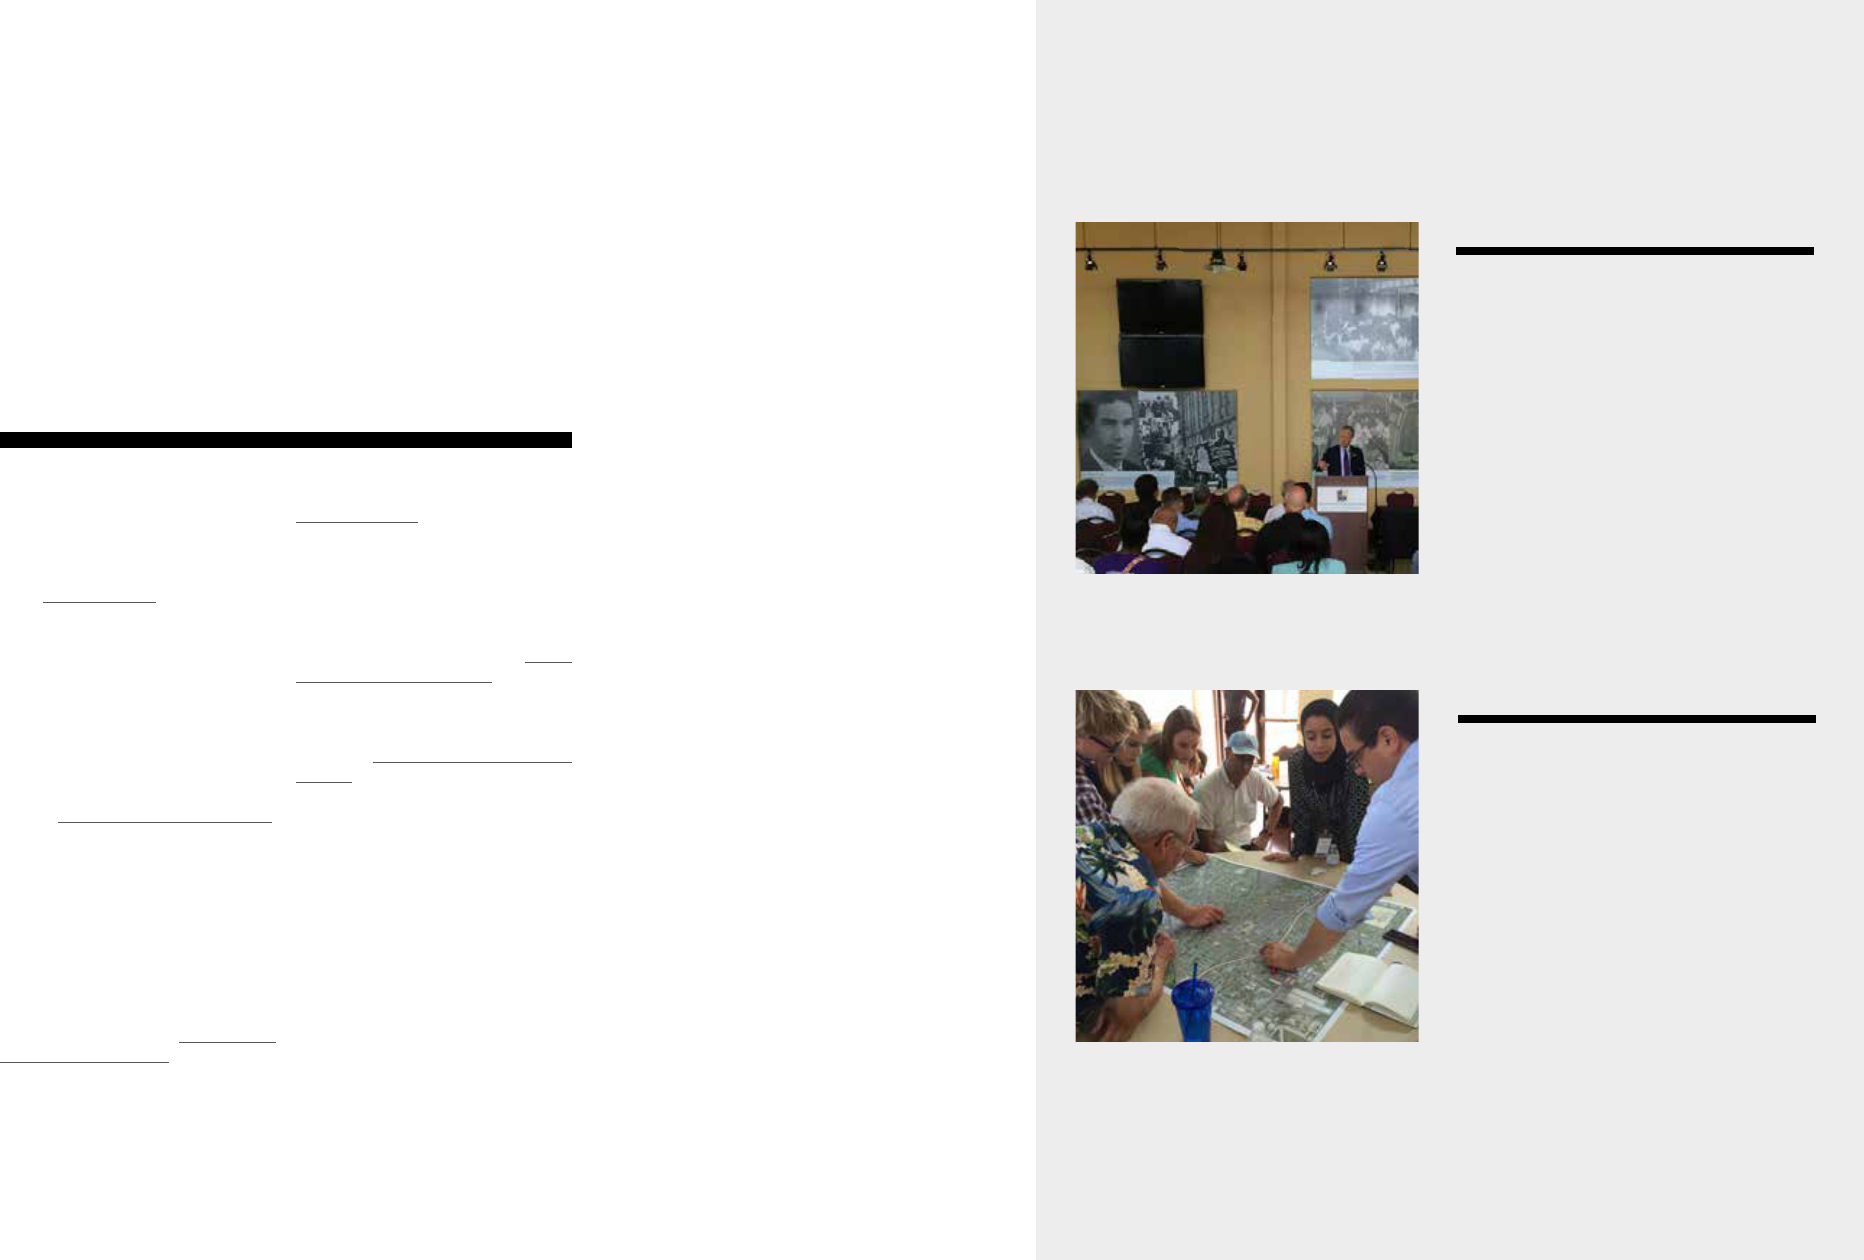
Communities by Design
The signature service of the AIA Center
for Communities by Design is bringing
community leaders together with sustain-
able design assessment teams (SDAT)
to help citizens stake a claim to their
future. The work of the design assistance
program harnesses the potential of design
to create sustainable, livable communi-
ties and connects with our deep desire
to help make the world a better place.
The Community Development Society
International heralded the Center as
outstanding in 2015. The award cited
the SDAT program as one that “leads to
enormous changes in local approaches
by combining community engagement,
listening and reflecting, explaining new
ideas and making clear and concise
recommendations that respect and reflect
community priorities in a way that enables
communities to develop frameworks and
comprehensive plans.”
Community
How we serve our communities defines us as an
organization and as a profession. In 2015, the
answers were increasingly rich and diverse.
>>> EXAMPLE
Louisville, KY
An SDAT devised a revitalization strategy for
Russell, a neighborhood where 58 percent
of residents live below the poverty line and
residents face 30 percent unemployment.
About 15 percent of its housing stock is vacant
and crime is five times the citywide rate. The
SDAT suggested an urban design strategy to
reconnect the neighborhood to downtown and
redesign an underutilized state-owned parking
lot into higher-density, mid-rise residential
buildings above restaurant, retail, cultural and/
or entertainment spaces. The team proposed that
the neighborhood create a civic organization and
leverage modest public investments to attract
larger private investment. The community was
enthusiastic. The steering committee chair
remarked, “I simply can’t believe how much work
you were able to complete in just three days.”
Del Paso Heights and SDAT participants discuss the
specifics of a community development plan designed to
establish an economic identity that will promote its viability
to the city of Sacramento.
Sacramento, CA
An SDAT focused on transforming Del
Paso Heights, a struggling neighborhood in
Sacramento. The team called for creating a
Community Development Corporation to
establish an economic identity and promote its
viability to the city. It suggested an urban design
strategy for a town center with new approaches
to housing and retail infill, and public private
partnerships to enhance local infrastructure.
Residents applauded the recommendations. One
said, “I’d like to commend you very highly for
what you’ve done. I didn’t think in three days
much could be done, and you’ve really shown us
a vision of what is possible.”
Residents of Russell, KY hear details of 2015 AIA SDAT
recommendations that, if implemented, will help revitalize
the community.
p // 172015 ANNUAL REPORTp // 16 THE AMERICAN INSTITUTE OF ARCHITECTS
AIA Convention 2015
It was one of our best, most inspiring and most
impactful events yet, bringing thousands of
architects and design professionals to Atlanta
and setting a few new records.
“ To the extent that we’re going to avoid the
worst consequences of climate change, we are
depending on [architects] and people like you,
and those who begin more to think like you,
about how to design the environment in which
we live and work.”
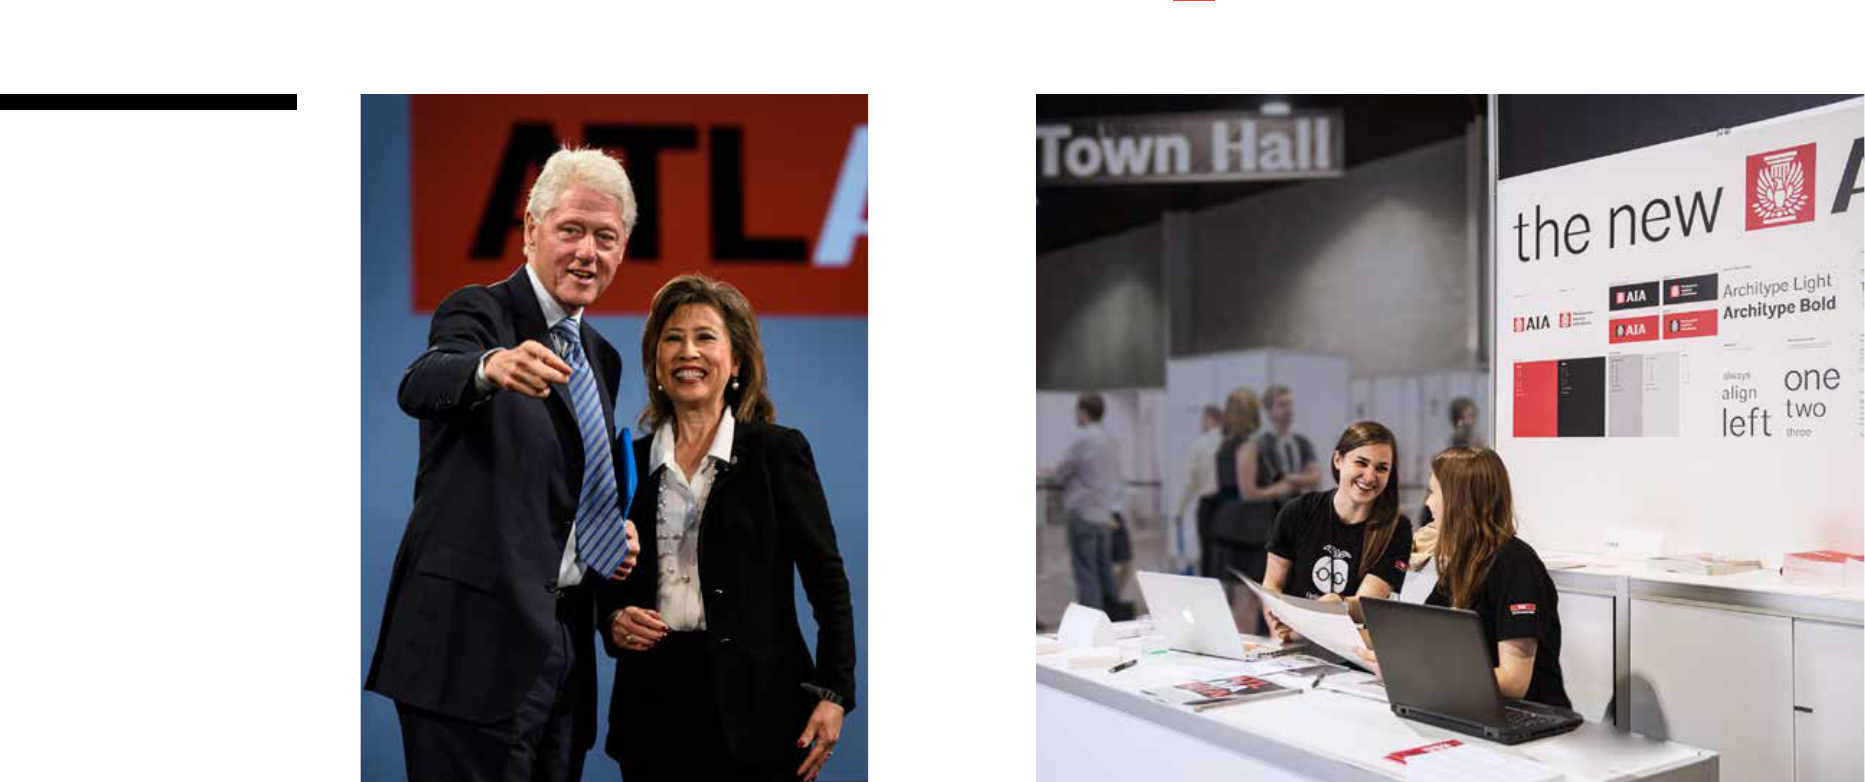
Former President Bill Clinton, Day 1 keynote
Bringing a profession together
The AIA Convention 2015 in Atlanta delivered
on its billing. For nearly 17,000 attendees the
annual convention offered targeted seminars,
educational sessions and architectural tours.
Former President Bill Clinton delivered the
opening keynote, drawing a straight line from
what architects do to the needs of society. He
attracted the largest general session audience
in our convention history. Trending Topics
USA ranked #aiacon15 the nation’s eighth
most popular Twitter hashtag on May 14, the
opening of the three-day event.
Sustainable convention
The convention advanced AIA’s greening
initiative with a notable reduction in the
use of printed materials and increases in
recycling and waste diversion. Add to that the
attendees’ contributions to carbonfund.org
to offset 212.6 metric tons of CO
2
emissions.
Former President Bill Clinton shared his insights with attendees at
the AIA Convention 2015, calling on architects to do their best in
addressing the most pressing issues of climate change.
Photo credit: Carl Bower
AIA national staff manning the booth at Town Hall. Photo credit: Carl Bower
p // 192015 ANNUAL REPORTp // 18 THE AMERICAN INSTITUTE OF ARCHITECTS
Recognition
Recognizing excellence
We joined our members, the industry
and the media in celebrating some of the
world’s best new architecture, visionary
projects and up-and-coming architects
by awarding recognition across nearly
30 categories.
Our highest honor—AIA’s Gold Medal—
was awarded to Moshe Safdie, FAIA,
for the practice of architecture “in the
purest and most complete sense of the
word, without regard for fashion, with a
hunger to follow ideals and ideas across
the globe in his teaching, writing, practice
and research.” In his acceptance speech,
Safdie called for “a new urban vision”
in which city centers are reinvented
to integrate culture, commerce and
government and malls give way “to vital
and inclusive city centers worthy of our
civilization.”
Ehrlich Architects of Culver City, Califor-
nia, received the 2015 AIA Architecture
Firm Award. Ehrlich’s projects in the
American Southwest, the Middle East and
Africa are notable for blending classic
California modernist style with multicul
-
tural and vernacular design elements.
The 2015 AIA Twenty-five Year Award
recognized the distinctive façades of
Broadgate Exchange House in central
London, completed in 1990. Defined by
two parabolic arches against grids of
windows, the Skidmore, Owings & Merrill
design strategy was to vault 10 stories of
offices over rail tracks feeding Liverpool
Street Station. The result: a mid-century
modern icon.
The Rural Studio of Newbern, Alabama,
received the 2015 Whitney M. Young Jr.
Award for its work to design and build
homes and community buildings for west-
ern Alabama residents, almost 40 percent
of whom live below the poverty line.
Peter Eisenman, FAIA, was the 2015
AIA/ACSA Topaz Medallion recipient
in recognition of his writings, research
and scholarship and his commitment to
teaching.
COTE Top 10 for Students
The Committee on the Environment
(COTE) awards proved well-established
just one year in, drawing 400 entries from
40 schools. The 10 individual and student
team winners and their faculty advisors
addressed a challenging sustainable
design program, integrating natural
systems and technology to provide
architectural solutions to protect and
enhance the environment.
Practitioners
to watch
2015 Young Architects Awards
José Alvarez, AIA
An ardent advocate for design
excellence and a profession that
embraces diversity
Zachary R. Benedict, AIA
A leader who connects urban
sociology and social interaction
to show new roles architecture
can play
Hafsa Burt, AIA
A business owner, green building
advocate, mentor and exemplary
role model for architects
Justin Crane, AIA
An architecture festival creator
who connects the profession
with the public to deepen the
value of good design
Sarah W. Dirsa, AIA
An inspiring leader who gives
back to her community through
architecture
Andrew Dunlap, AIA
An intellectually curious designer
who leads by example
James Henry, AIA
A talented design principal
dedicated to advancing health
and wellness through design
Chris Hong, AIA
A capable leader committed
to helping others and
promoting architecture as a
public good
James A. Meyer, AIA
An advocate who harnesses
underutilized design profession
resources to enhance
stewardship of the public realm
Ann Sobiech Munson, AIA
A city council member with a
passion for broadening public
understanding of the profession
Adrianne Steichen, AIA
A committed leader and
advocate for affordable housing
Rebecca Talbert, AIA
An architect, educator and
advocate who leverages academic
expertise to effect real change
Derek C. Webb, AIA
An architect, educator and
mentor committed to the
professional development of
emerging professionals
Elizabeth Whittaker, AIA
An innovator helping pave the
way for other architects to
embrace the “maker” ethos of
the profession
2015 Associates Awards
Stephen Francis Gray, Assoc.
AIA
A community activist and leader
dedicated to improving the
built environment and helping
communities
Mary E. Hale, Assoc. AIA
An inspiring advocate for
improving the world through
architectural design and public
discourse
“I always tell my
students that if every
time they take a pencil
in hand to design,
if they can identify
completely with those
who will live, work and
be in their building, it is
half the way to victory.”
Moshe Safdie, FAIA, accepting the
2015 Gold Medal
2015 Honor Award for Architecture recipient John Jay College of Criminal Justice, designed by Skidmore, Owings & Merrill provides
all the functions of a traditional college campus within the confines of a single city block. The jury commented, “The diversity of
space is impressive, and it is hard to imagine that it could be done better.” Photo credit: Eduard Hueber | Archphot; Brett Beye
2015 AIA Gold Medal recipient Moshe Safdie
accepts the congratulations of colleagues
attending the AIA convention
Photo credit: Carl Bower
p // 212015 ANNUAL REPORTp // 20 THE AMERICAN INSTITUTE OF ARCHITECTS

Architects Foundation
Addressing local & global needs
In 2015, the Architects Foundation
worked to prepare tomorrow’s architects
for the challenges that lay ahead—
enhancing and expanding scholarships,
including the Diversity Advancement
Scholarship, which in addition to
financial support provides mentors and
professional training opportunities.
Through its major programs, the
Foundation advanced its efforts to
connect design professionals with the
immediate and long-term needs of
communities.
National Resilience Initiative
The Foundation’s National Resilience
Initiative (NRI) is building a nationwide
professional and academic network of
design programs that create community-
based resilience solutions. With support
from AIA, the Rockefeller Foundation’s
100 Resilient Cities, the Clinton Global
Initiative, Public Architecture, and the
Association for Collegiate Schools of
Architecture, the NRI added two design
studios: Mississippi State University’s Gulf
Coast Community Design Studio and
the University of Arkansas Community
Design Center. These centers offer design
services to households and communities
on issues ranging from hurricane
risks to the complexities of population
growth, transit-oriented development
and watershed urbanism. The goal is to
forge local solutions that are models for
mitigating social and disaster-related risk
around the globe.
Resilience & reconstruction
The Foundation partnered with the
relief organization All Hands Volunteers
to launch a three million dollar
reconstruction program for the villages
in Nepal devastated by the April 25,
2015 earthquake. The two-year initiative
includes coordinating with the Society of
Nepalese Architects (SONA), ARCASIA
(Architects Regional Council Asia) and
Small Works with the intention of building
up to 75 model homes compliant with
international model building codes and
increased resilience to natural disasters.
Training will be made available to
enhance Nepal’s design and construction
practices. The final phase will extend the
program into other Nepalese villages and
communities.
In communities from Nepal to Arkansas, the
Architects Foundation put its mission into
action, using the power of design to transform
lives, solve problems and create a better world.
The Architects Foundation launched a three million dollar reconstruction initiative in 2015 to rebuild
Nepalese villages and improve construction techniques in areas effected by a devastating earthquake.
Photo credit: Getty Images
p // 232015 ANNUAL REPORTp // 22 THE AMERICAN INSTITUTE OF ARCHITECTS

“ For the fifth year running, the American Institute
of Architects (AIA) has crunched the numbers on
its national sustainability challenge, the AIA 2030
Commitment…The square footage represented
in the AIA’s database has grown to 2.4 billion, an
increase of 50 percent. The number of architectural
projects represented has risen even more
dramatically to 4,354, a 78 percent increase. These
figures suggest that high-performance building is
gaining momentum among U.S. architects.”
The Atlantic’s CityLab: “Why Aren’t There More Energy-Efficient Buildings?”
October 22
“ Many fields have opportunities for student
loan assistance—or even forgiveness—if the
student agrees to contribute his or her expertise
to a worthwhile societal cause... Graduating
architectural students today have no opportunity
to get hands-on experience in return for student
loan assistance or forgiveness…That’s why
we are working with the American Institute of
Architecture Students and the American Institute
of Architects on H.R. 2938, legislation that will
create opportunities for emerging architectural
professionals to jumpstart their careers.”
Rep. Ed Perlmutter (DColo.) and Danielle Mitchell, President AIAS, The Hill,
“Pay off student debt with community service,” October 20
“ [Jon] Dick was also a juror on the
American Institute of Architects’ 2015
Housing Awards panel, which annually
recognizes 10 of the year’s best
buildings… All were inspired by the
family histories, cultures, and diverse
life experiences of the people who live
in them, and many of the architects
go the extra mile to accommodate
the landscapes and ecosystems of the
land on which they’re built.”
CBS Money Watch, “Architects pick 10 best homes of the
year,” May 15
“ On Earth Day, ten modern buildings were crowned
winners of the American Institute of Architects’
annual sustainable design competition. They
showcase attractive ways to reuse construction
materials, save water and energy, and improve
indoor air quality… ‘If a net-zero office building
can be built in Seattle, one of America’s cloudiest
cities, then one can be built anywhere in the
nation,’ say the jurors on AIA’s Committee on the
Environment.”
National Geographic, Earth Day Pictures, “10 of the World’s Greenest
Buildings,” April 22
AIA leaders, member experts,
data, policy positions and award
recipients were featured in more
than 6,000 articles or broadcast
segments in 2015.
p // 24 p // 252015 ANNUAL REPORTTHE AMERICAN INSTITUTE OF ARCHITECTS
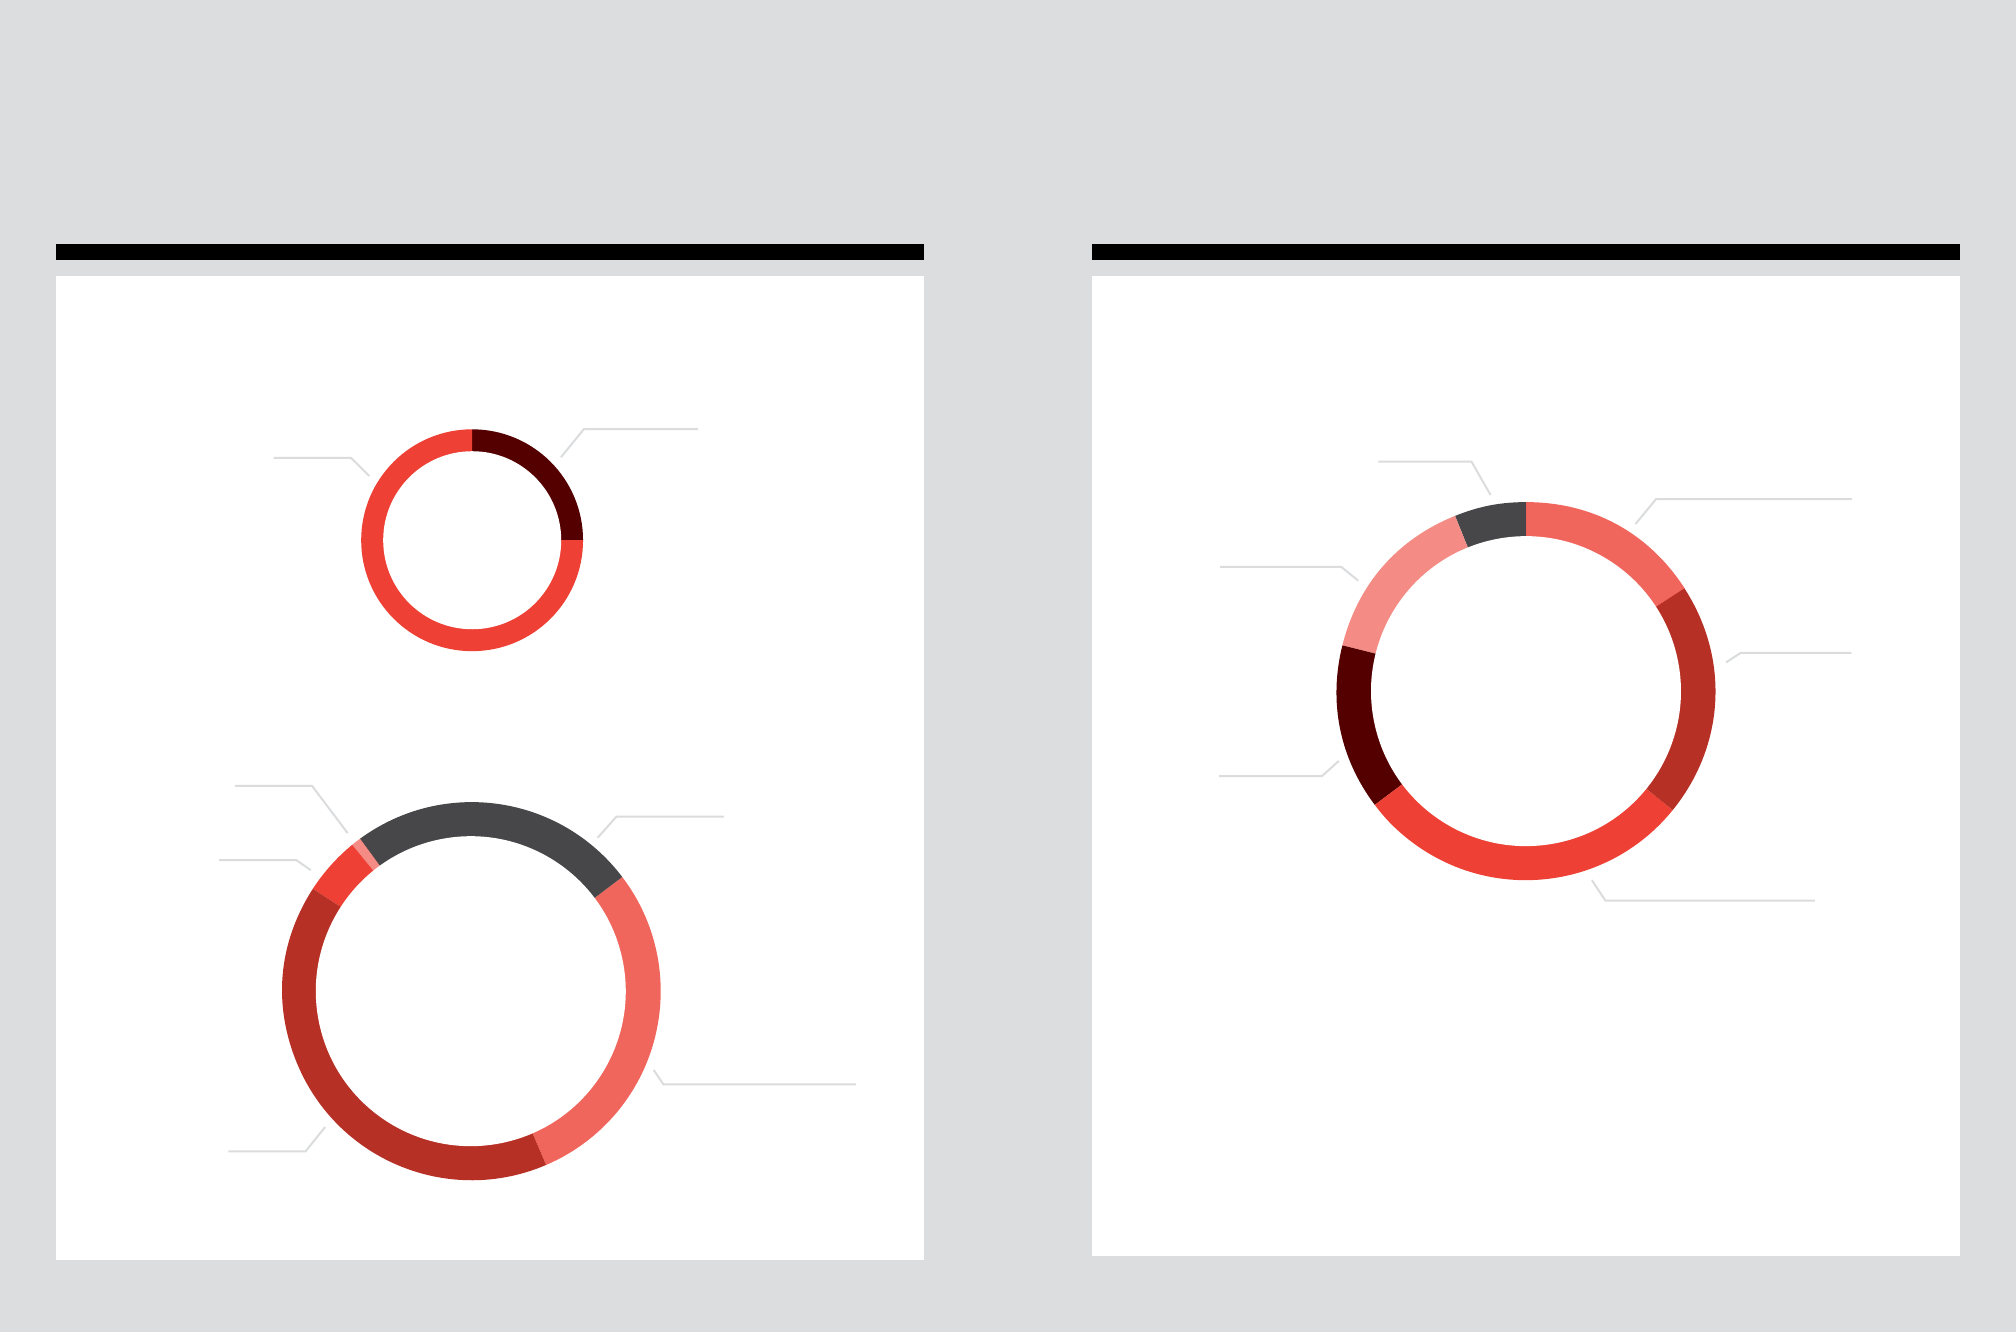
25%
Dues revenue
$16.8M
75%
Non-dues revenue
$49.5M
25%
Member dues
$16.8M
29%
Professional development
& conferences
$19M
41%
Member products
& services
$27.2M
5%
Building rent
$3.2M
<1%
Investments
$.1M
14%
Govt & public
advocacy
$9.3M
Building ops
$3.9M
16%
6%
Member & chapter support
$10.2M
29%
Member products & services
$18.9M
15%
General & admin
$10M
20%
Professional
development
& conferences
$13.3M
Financials
2015 Revenue
Total revenue: $66.3M
2015 Expenses
Total expenses: $65.6M
p // 26 p // 272015 ANNUAL REPORTTHE AMERICAN INSTITUTE OF ARCHITECTS
Strategic partners
>>> SPOTLIGHT
What a year it’s been! A new governance structure was
launched and we’ve achieved some serious firsts that point the
profession toward a more resilient and prosperous future.
We shared a compelling public message about the impact
of architecture in our world. We elevated important
conversations about diversity and advancement of women in
architecture. We tapped into our entrepreneurial spirit and
global opportunities. And we took action to ensure healthy
economics as an obligation to the next generation.
More than ever, we recognized it takes us all—a visionary
AIA Board, energetic Strategic Council, courageous chapter
leaders, dedicated staff, and, most of all, AIA members who
each day bring honor to our profession and a better way of life
to the communities we serve.
Elizabeth Chu Richter, FAIA
2015 AIA President
p // 28 THE AMERICAN INSTITUTE OF ARCHITECTS

1735 New York Avenue, NW
Washington, DC 20006
aia.org
